Excel PivotTables
Advertisement
To address the expressed need of low enrollment numbers, I created an advertisement to spread awareness of the PivotTables course.
I made sure the ad focused on course outcome, in-class vs. alternatives, and a call to action. By focusing on these three points, the learner can immediately understand why it matters, why this is the best option, and how to enroll.
To effectively communicate these points, I used the AIDA copywriting model (Attention, Interest, Desire, Action), by presenting a scenario, to ensure the viewing experience was engaging and compelling.
While the advertisement makes use of audio to get the points across with limited reading effort, visual elements such as characters and graphics are used to emphasizes the points and provide engaging stimulus.
I made an effort to show the end result and benefit of using PivotTables (by showing dashboards) rather than showing the lessons as to not “spoil it.”
Course Summary
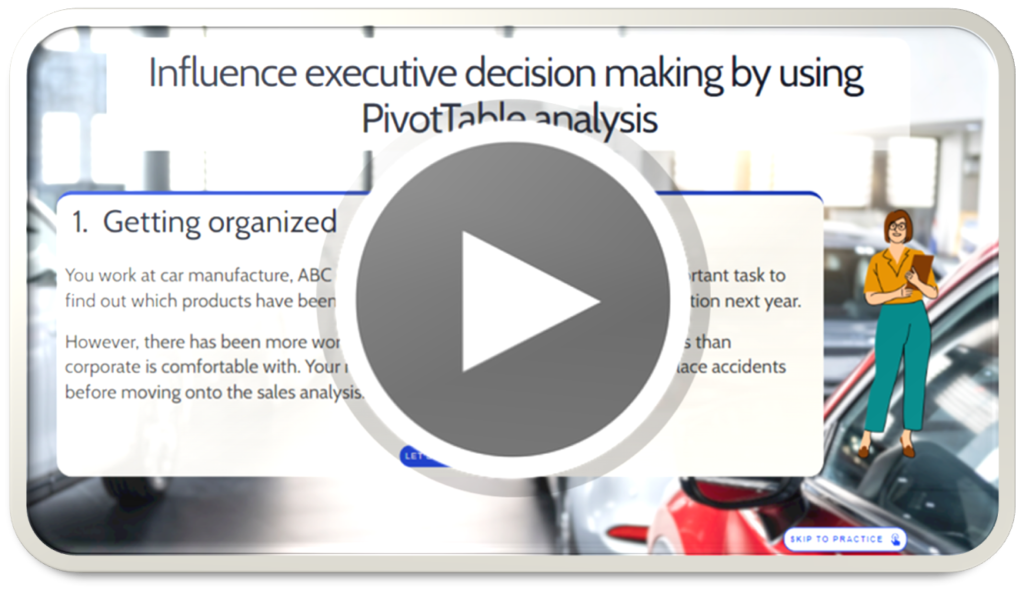
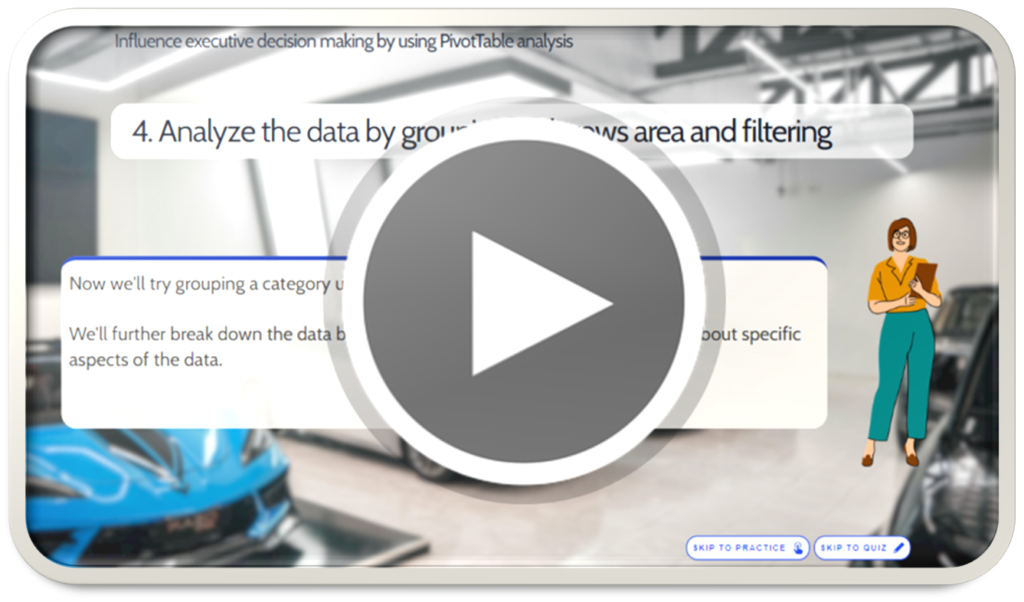
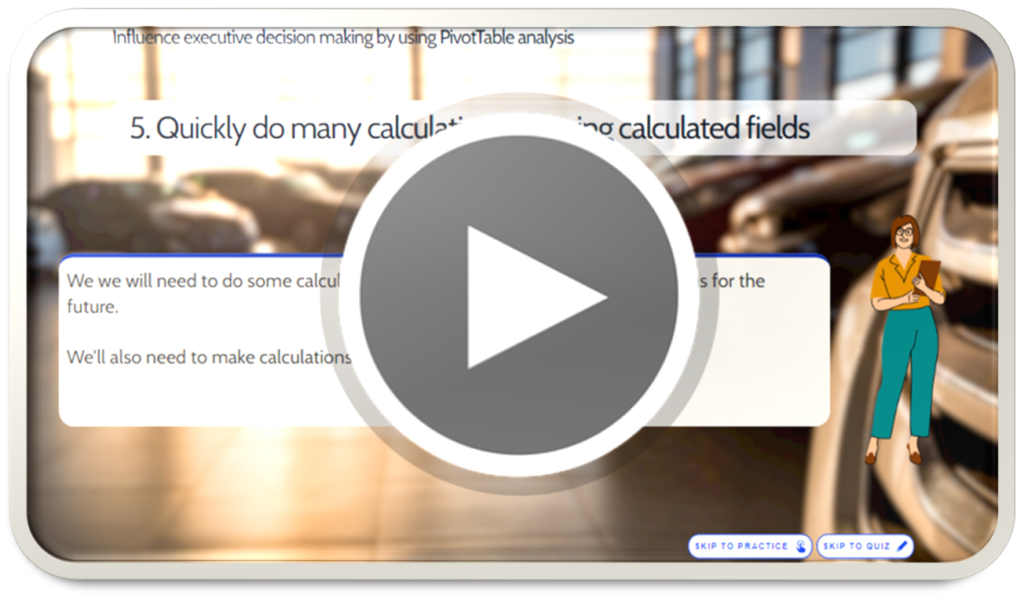
In order to address the lack of in-person class time needed to effectively cover and practice the skills presented, I designed and developed several modules that cover the key concepts of PivotTables and provide practice opportunities.
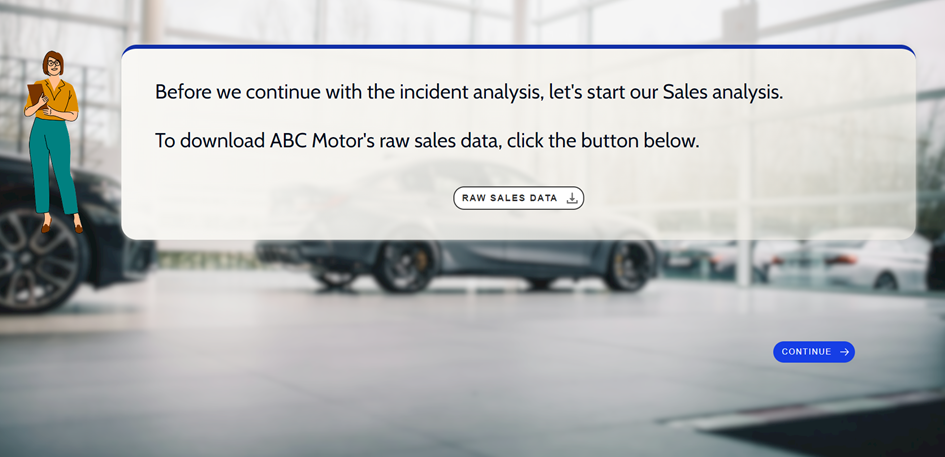
The course uses scenario-based learning to create an engaging experience for the learner. By putting the learner in an analysist role for a fictional car company, the learner can see why the content being learned matters and how it can be useful in the real world.

Each module covers one or two key concepts by showing the process of building and using PivotTables with a simulation.
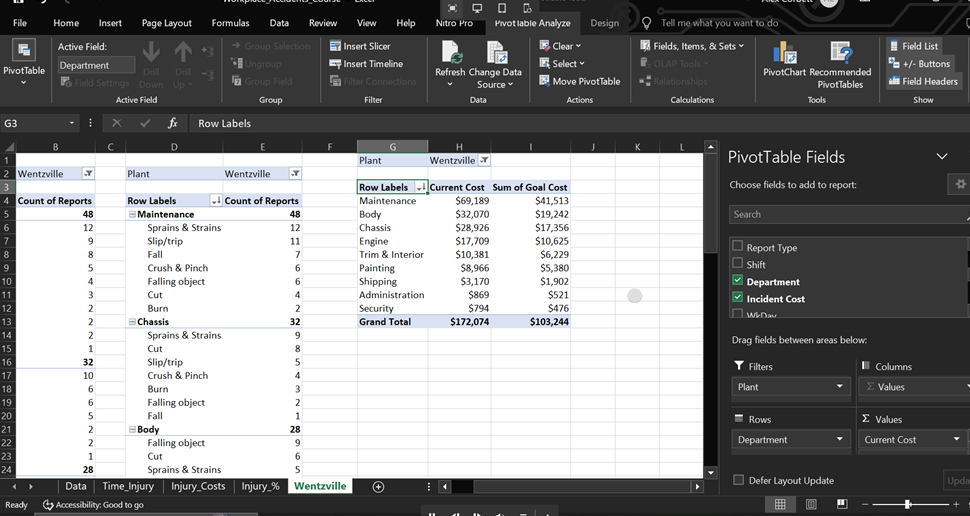
The simulations contain interactive sections to emphasize important features of the PivotTables.
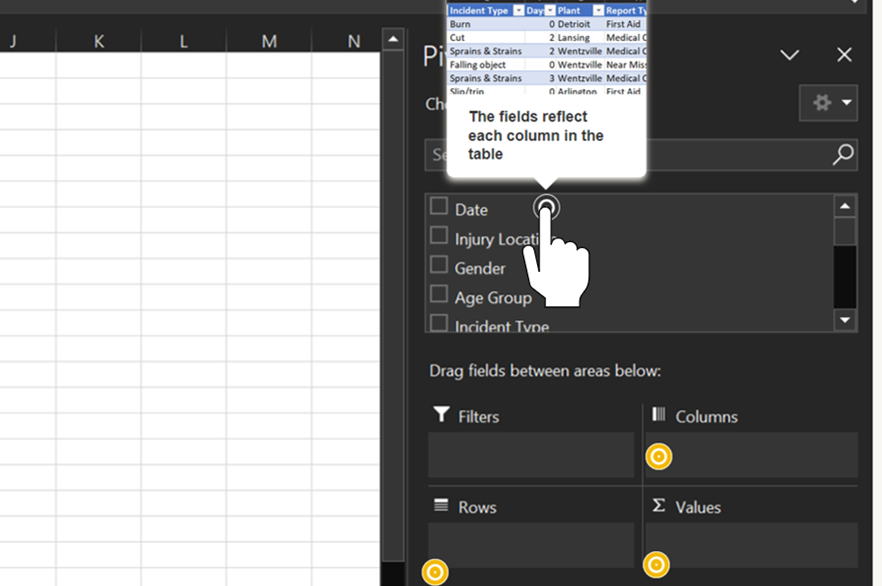
There is then a guided practice simulation to allow the learner to try implementing the concepts without making mistakes.
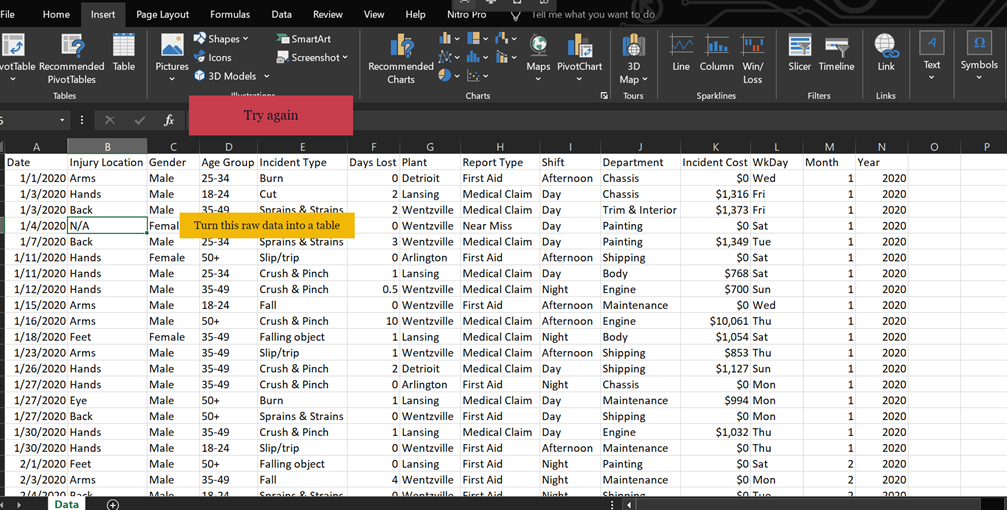
Finally, each module (starting with 2) ends with an unguided assessment that presents the learner with an excel document with raw data to manipulate, using the concepts learned from the module. When presented the question, the learner must implement the newly acquired PivotTable knowledge to find the correct answer.
Modules:
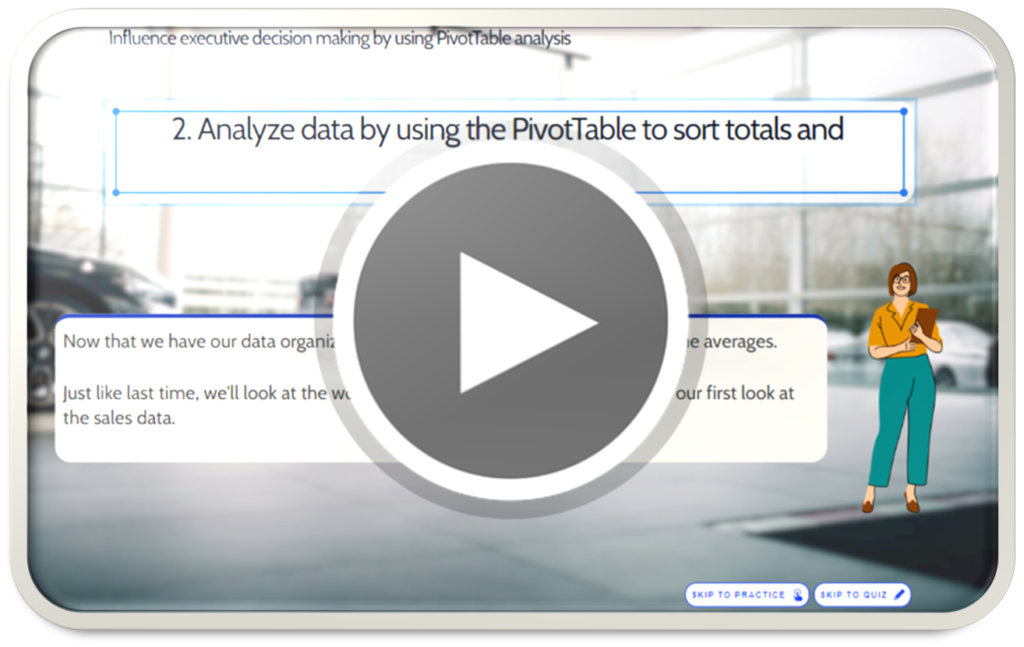
Module 2: Analyze data by using the PivotTable to sort totals and averages
- Simulation
- Practice
- Unguided quiz
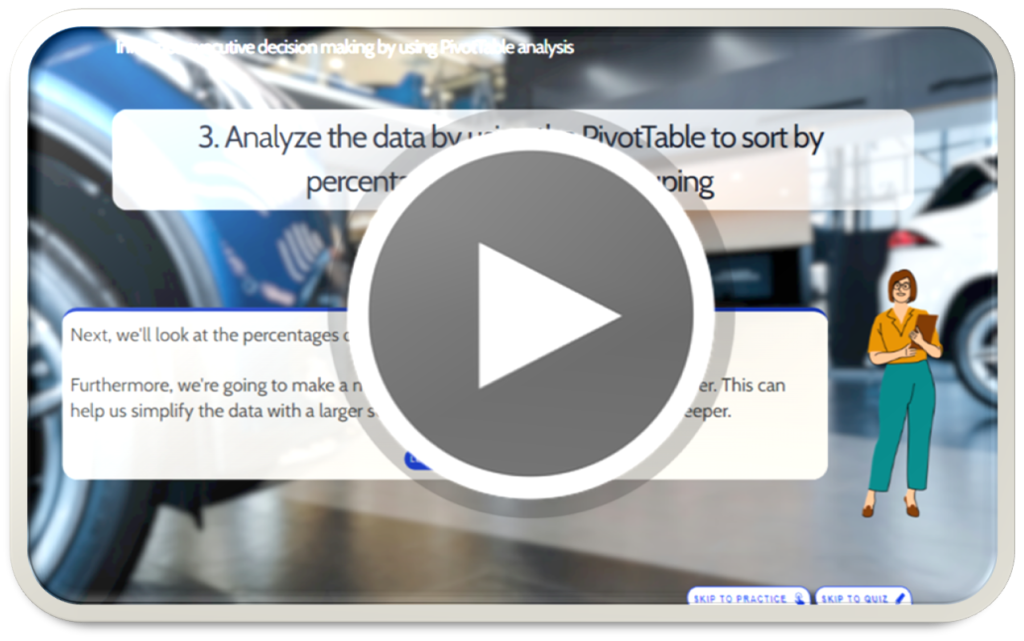
Module 3: Analyze data by using the PivotTable to sort by percentages and custom grouping
- Simulation
- Practice
- Unguided quiz

